
Ever feel like you know your customers but not really?
You see them scroll your site, click around, maybe even buy something. Yet it’s still unclear why they stayed… or why they left.
That’s exactly what customer behavior analysis is meant to uncover.
In a world where attention is short and loyalty is fragile, understanding why people engage or bounce isn’t optional anymore. It’s the difference between growth and slow fade-out.
Analytics platforms shine a light on every decision customers make not just what they do, but what drives them. And that insight? It can reshape your product, your marketing, and the way your brand shows up.
Let’s break it down and turn data into decisions you can actually use.
What Is Customer Behavior, Really?
Customer behavior isn’t just about purchases.
It’s the entire journey—from the first moment of curiosity to the final decision, and everything that happens after.
It includes:
- Time spent on pages
- Click paths and navigation
- Searches and filters used
- Drop-offs, rage clicks, and exits
- Repeat visits and long-term loyalty
Each action tells part of a story.
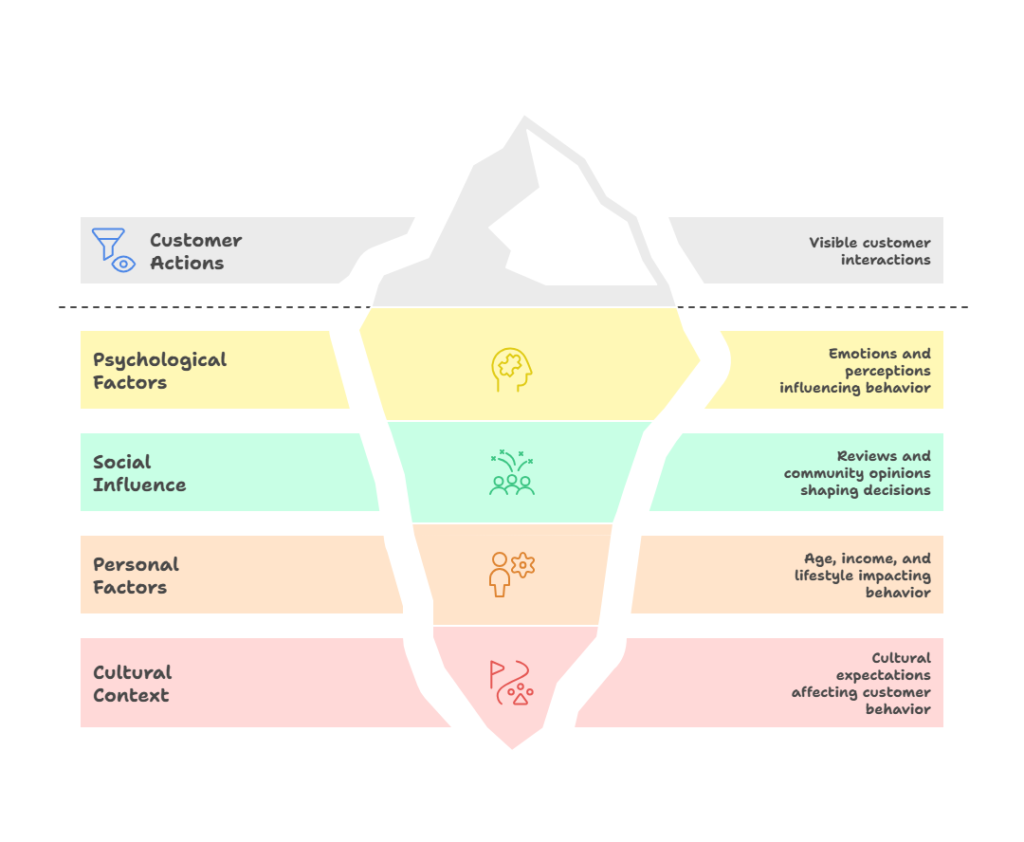
What Drives Customer Behavior?
Behavior doesn’t happen randomly. It’s influenced by a mix of four core factors:
1. Psychological Factors
Emotions, perceptions, gut reactions.
Design, colors, layout, and messaging impact how users feel. Confusion pushes them away. Clarity pulls them closer.
2. Social Influence
Reviews, influencers, referrals, and community opinions shape decisions—especially in retail, fitness, and food. Social proof builds trust fast.
3. Personal Factors
Age, income, lifestyle, education—context matters. A college student behaves very differently from a retired professional. Segmentation is critical.
4. Cultural Context
Culture affects tone, humor, expectations, and trust. What resonates in one region may miss in another. When you understand these drivers, product design and marketing alignment become easier—and more effective.
How Do You Analyze Customer Behavior?
Now for the practical side—how you actually uncover insights.
Start with Data Collection
You can’t analyze what you can’t see. Customer behavior data usually comes from:
- Surveys & Forms
Tools like Google Forms or Typeform help capture direct feedback. Keep questions simple and purposeful. - Customer Interviews
One-on-one conversations reveal nuance dashboards can’t. Especially valuable for SaaS and service-based businesses. - User Observation
Screen recordings and session replays (e.g., FullStory) expose friction points numbers alone miss. - Digital Analytics Tools
Platforms like Google Analytics, Mixpanel, and Hotjar track clicks, scrolls, funnels, and exits.
In offline environments, POS data, sensors, or CRM entries play a similar role.
Use the Right Analytics Tools
Once data flows in, these platforms help you understand it:
- Google Analytics – Traffic sources, behavior flow, exits
- CRM Tools (HubSpot, Salesforce) – Connect actions to real users and lifecycle stages
- Heatmaps & Session Tools (Hotjar) – Visualize attention and frustration
- Social Media Analytics – Track sentiment, conversation, and engagement
Different industries use different stacks—retail, healthcare, SaaS, and finance all adapt analytics slightly—but patterns are universal.
Steps to Deeply Analyze Customer Behavior
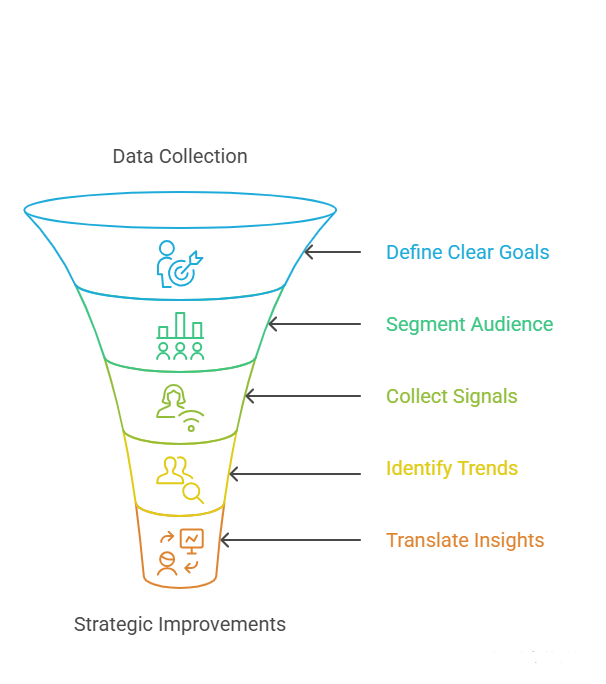
1. Define Clear Goals
Data without goals is noise.
Are you trying to:
- Reduce cart abandonment?
- Increase demo bookings?
- Improve onboarding completion?
- Boost repeat purchases?
Define success first. Then analyze behavior around it.
2. Segment Your Audience
Not all users behave the same.
Segment by:
- New vs returning users
- High-value vs low-intent visitors
- Device type
- Traffic source
- Demographics
Segmentation reveals hidden patterns—especially in long purchase cycles.
3. Collect the Right Signals
Go beyond basic metrics.
Track:
- Scroll depth
- Feature usage
- Video engagement
- Email clicks
- Support interactions
- Feedback forms
Choose data points that connect directly to your goals.
4. Identify Behavior Trends
Look for repeat patterns:
- Common funnel drop-offs
- High-bounce devices or pages
- Time-based engagement spikes
- Onboarding behaviors linked to retention
Tools like Mixpanel, Heap, or Tableau help visualize these trends clearly.
5. Translate Patterns Into Insights
This is where insight turns into action.
Examples:
- Drop-offs after signup → onboarding too complex
- Low course completion → content too long
- Low feature usage → poor visibility
The best fixes are often small but strategic:
- Simplify steps
- Add tooltips
- Improve prompts
- Automate nudges
Metrics That Actually Matter
Not everything deserves attention. These do.
A. Customer Demographics
Age, location, income, role—these guide personalization and messaging.
B. Purchase Behavior
Track:
- Frequency
- Bundling
- Refund patterns
- Seasonal demand
This helps forecast and optimize offers.
C. Customer Journey Mapping
Visualize the full path—from first visit to conversion.
Spot friction, delays, and drop-offs early.
D. Feedback & Sentiment
Use:
- NPS surveys
- Reviews
- Support tickets
- Social mentions
Behavior + emotion = full context.
E. Engagement Metrics
Watch:
- Time on site
- Feature adoption
- Funnel progression
- Bounce rate
These signals show whether your experience truly works.
Turning Behavior Insights Into Strategy
Insights only matter if you act on them.
A. Personalized Marketing
Recommend what users already show interest in. Relevant messaging beats generic blasts every time.
B. Experience Optimization
Use behavior data to:
- Simplify flows
- Remove friction
- Improve UX
Small changes = major impact.
C. Smarter Product Decisions
Low usage doesn’t mean failure—it means insight. Improve visibility or stop forcing features users ignore.
D. Retention & Re-Engagement
Spot drop-off risks early and act:
- Email reminders
- Incentives
- Feature education
Retention always beats reacquisition.
Common Pitfalls to Avoid
A. Data Privacy & Compliance
Be transparent. Collect only what you need. Respect laws like GDPR and HIPAA. Trust is non-negotiable.
B. Fragmented Data
Disconnected tools create blind spots. Integrate analytics, CRM, and feedback systems wherever possible.
C. Analysis Paralysis
Too much data can stall decisions. Focus on dashboards that show impact, not just activity.
Final Thoughts: Know Them—or Lose Them
Your customers are constantly communicating.
Every click, scroll, pause, and exit is feedback.
Customer behavior analysis isn’t a trick—it’s how businesses stop guessing and start responding. Whether you run a SaaS company or a bakery, understanding behavior helps you build trust, relevance, and loyalty.
The brands that win don’t spy they listen.
And when customers feel understood, they stick around.