
Introduction
You’ve launched campaigns, tweaked headlines, tested ad sets, emailed lists… but eventually, you realize something big:
None of it matters if you can’t see what’s actually working.
Marketing is noisy. Data is scattered—clicks here, bounce rates there, random social likes, and email opens that don’t always translate to action. What you need isn’t more numbers—it’s clarity.
That’s where marketing dashboards come in.
Think of a dashboard as the cockpit of a plane. Can you fly without one? Sure. But it’s guesswork. A dashboard collects scattered data points and turns them into insights you can understand and act on—fast.
This guide walks you step-by-step through building a marketing dashboard that’s powerful, practical, and built for real decision-making—whether you’re solo or part of a giant org.
Let’s dive in.
Understand Your Marketing Goals and KPIs
Before touching any tools or charts, start with one question:
What exactly are you trying to improve?
Be specific. Clear goals drive useful dashboards.
You might want to:
- Increase visibility in a new market
- Grow your email list to 10k+ engaged subscribers
- Reduce wasted ad spend
- Improve customer retention after first purchase
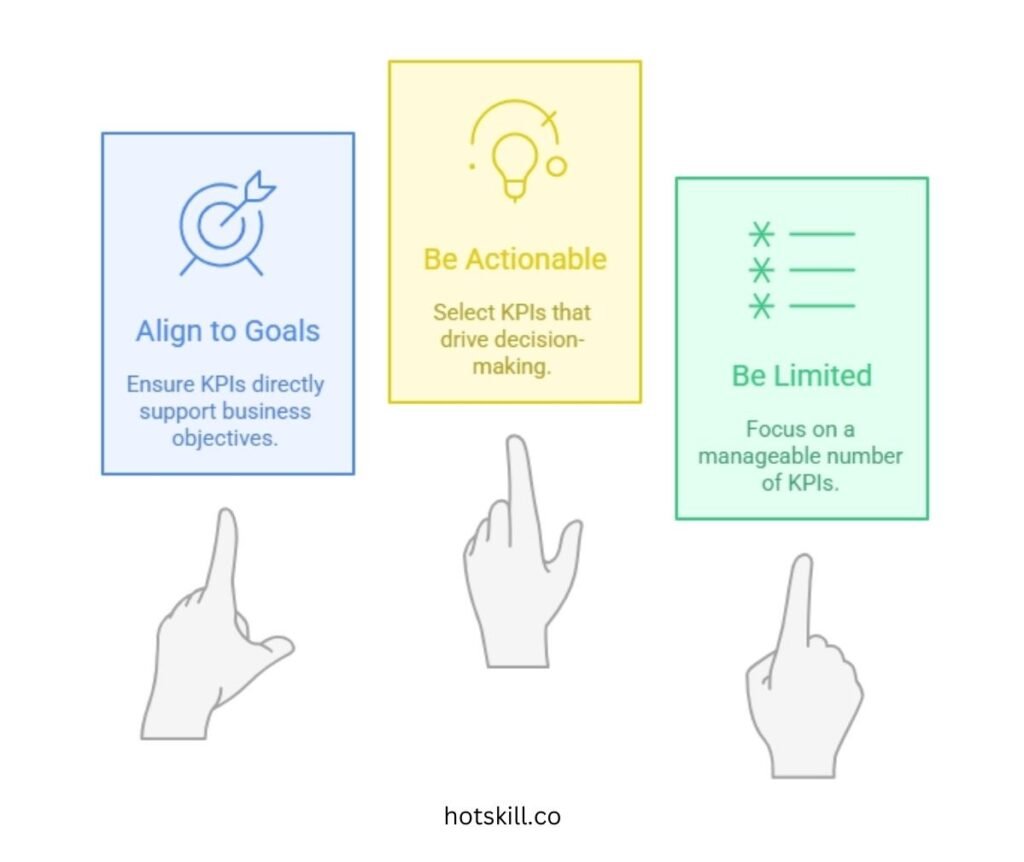
Choose the Right KPIs
Your KPIs should:
- Align to your goals
- Be actionable (not vanity metrics)
- Be limited (aim for 5–8 max)
Examples:
- Click-through rate from retargeting ads
- Customer acquisition cost (CAC)
- Email click-to-open rate
- Qualified leads per channel
- Revenue per campaign
If a metric doesn’t influence decisions, it doesn’t belong on your dashboard.
Choose the Right Tools and Platforms
Once goals and KPIs are set, choose a tool that plays well with your data stack.
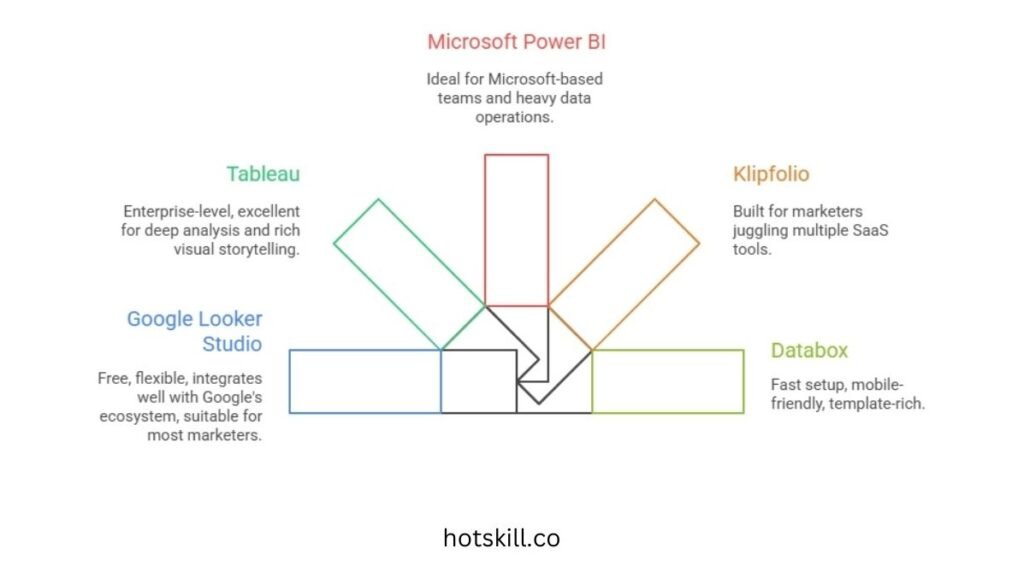
Popular Dashboard Tools
Google Looker Studio
Free, flexible, integrates well with Google’s ecosystem. Great for most marketers.
Tableau
Enterprise-level, excellent for deep analysis and rich visual storytelling.
Microsoft Power BI
Ideal for Microsoft-based teams and heavy data operations.
Klipfolio
Built for marketers juggling multiple SaaS tools.
Databox
Fast setup, mobile-friendly, template-rich.
How to Choose the Right Tool
Look for:
- Easy integration with your existing tools
- Intuitive interface (no dev needed for every update)
- Near real-time data sync
- Room to scale as new channels and CRMs are added
Choose a tool that fits your workflow—not the other way around.
Collect and Integrate Data Sources
Your dashboard is only as good as the data flowing into it.
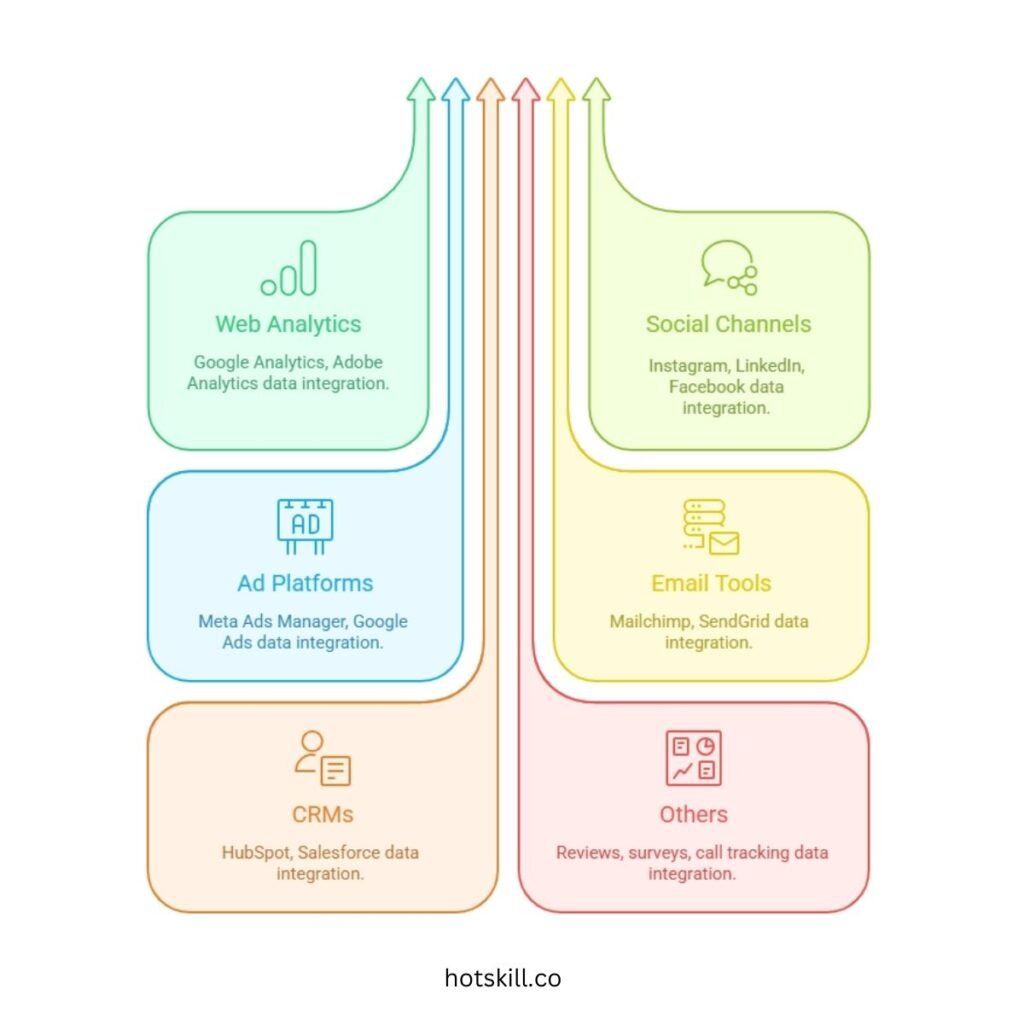
Common Data Sources
- Web Analytics: Google Analytics, Adobe Analytics
- Social Channels: Instagram, LinkedIn, Facebook
- Ad Platforms: Meta Ads Manager, Google Ads
- Email Tools: Mailchimp, SendGrid
- CRMs: HubSpot, Salesforce
- Others: Reviews, surveys, call tracking tools
Integrating Your Data
Two workflows:
- API connections — best option; real-time and automated
- Manual uploads — workable but requires discipline
Tools like Supermetrics, Zapier, Funnel.io make integrations easier.
The goal: build a cohesive, unified picture—not a disjointed data puzzle.
Design Your Marketing Dashboard
Now, shape the data into something humans can understand.
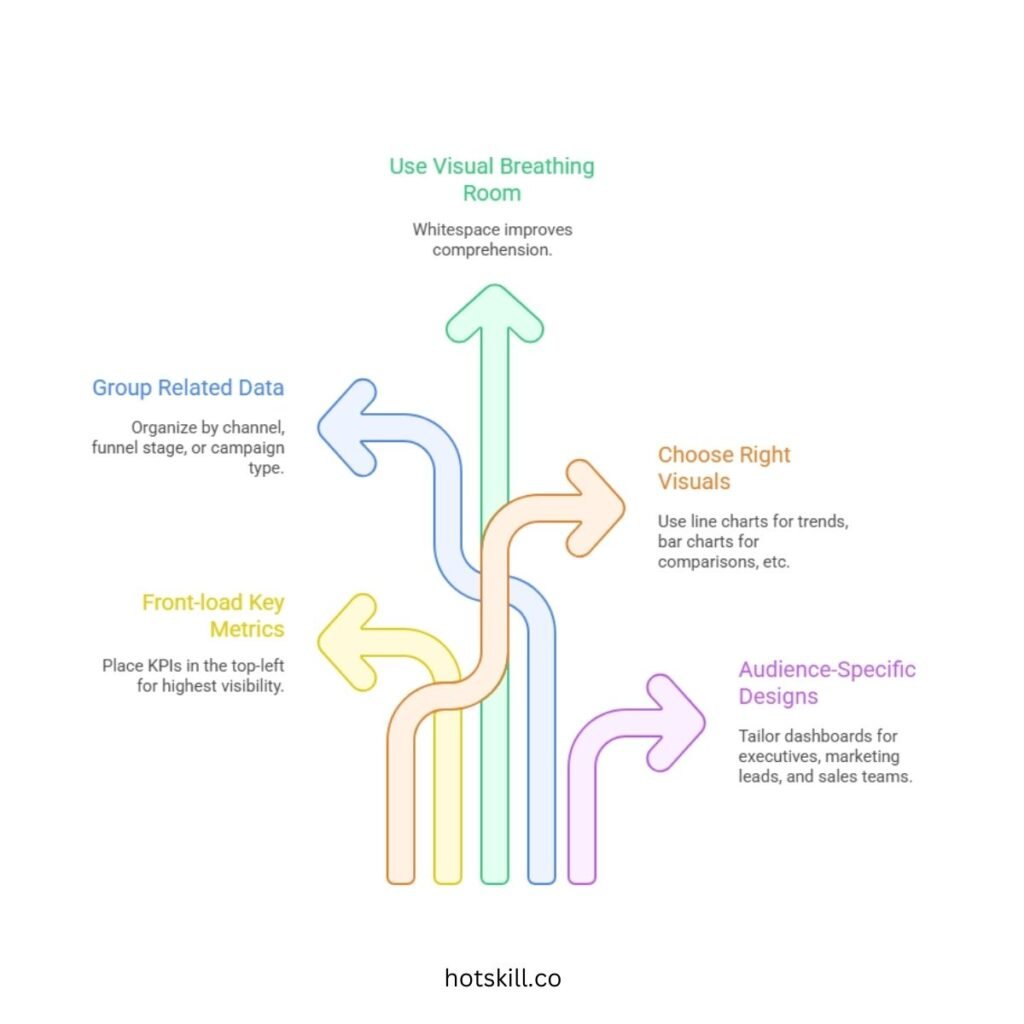
Dashboard Design Principles
Front-load key metrics
Top-left section = highest visibility → place your KPIs here.
Group related data
Organize by channel, funnel stage, or campaign type.
Allow visual breathing room
Whitespace improves comprehension. Don’t overcrowd.
Use the Right Visuals
- Line charts → Trends over time
- Bar charts → Comparisons (campaigns, regions, devices)
- Scorecards → Key numbers at a glance
- Heat maps → Best-performing times, locations, or segments
Audience-Specific Designs
- Executives: high-level KPIs + red/yellow/green indicators
- Marketing leads: attribution, funnel performance
- Sales teams: lead sources, pipeline insights
Often you’ll create multiple dashboards fed by the same data—this keeps views clean and relevant.
Set Up Real-Time Reporting and Alerts
Marketing shifts fast. You need data that keeps up.
Real-time Reporting
- Aim for hourly refreshes if possible
- Daily minimum for slower-moving industries
Set Alerts for Critical Metrics
Examples:
- CPL rises beyond target
- CTR drops 20% from previous day
- Website outage spikes bounce rate
- Ad budget overspends
Send alerts via Slack, SMS, or email—where your team actually works.
Real-time alerts turn dashboards into early-warning systems, not just reports.
Test and Refine Your Dashboard
Don’t assume a dashboard works—validate it.
What to Test
- Accuracy: Match data with source platforms
- Usability: Can a teammate navigate it without guidance?
- Relevance: Are these metrics driving actual decisions?
Collect Feedback
Ask:
- What’s confusing?
- What’s rarely used?
- What’s missing?
Iterate Regularly
Dashboards are living tools. As campaigns, goals, and tools change—your dashboard should evolve too.
Maintain and Update Your Dashboard
Dashboards age quickly.
Monthly Checks
- Validate data accuracy
- Look for broken integrations or missing fields
Quarterly Reviews
- Reassess KPIs
- Remove outdated metrics
- Add new priorities
Build Multiple Dashboards
Avoid the “Frankenstein dashboard.”
Instead, create:
- Ad Performance Dashboard
- Email Marketing Dashboard
- Web Analytics Dashboard
- Executive Summary Dashboard
Pull only the highlights into the C-suite view.
Conclusion: Dashboards Are Conversations, Not Console
Marketing dashboards aren’t about decoration. They’re about clarity.
They:
- Help teams stop guessing
- Spot problems early
- Reveal opportunities
- Align marketing, sales, and leadership
- Turn data noise into strategic focus
The future is even smarter—AI alerts, predictive insights, personalized views—but none of that matters until you build your foundation now.
Pick your goals. Choose your KPIs. Start small. Keep improving.
Once you can truly see what’s happening, your entire marketing strategy gets sharper.
Start today.
Your future team will thank you.