
Introduction
Product marketing moves fast, and without the right KPIs in place, it’s easy for teams to assume things are working when they’re actually not. Strong KPI tracking keeps everyone grounded. It shows which messages resonate, which channels actually drive traction, and whether a launch is headed in the right direction.
And when the tracking is done well, you see the difference almost immediately, smoother launches, better customer engagement, clearer wins. Even small tweaks become easier because there’s data guiding every step instead of hunches.
A simple, structured approach to product marketing KPIs helps teams track marketing performance with more confidence. No fluff. Just the numbers that show whether you’re moving toward real growth, or drifting away from it.
Short note here: KPIs make everything clearer.
Why Tracking Product Marketing KPIs Matters
Every business goal, growth, retention, visibility, connects back to KPIs in some way. When those numbers are tracked consistently, patterns start appearing that otherwise stay hidden.
A few things become obvious:
- Revenue doesn’t grow by accident.
- Customers don’t stay unless the product experience matches their expectations.
- Brand awareness doesn’t improve just because the team “feels” active online.
Skipping KPI measurement leads to predictable problems. Budgets get wasted. Teams argue over opinions. Decisions slow down because no one knows what’s actually working. Sometimes, it even looks like campaigns failed when the real issue was that no one tracked the right metrics.
Clear, steady measurement of marketing performance metrics gives product teams the confidence to refine, rebuild, or double down. It strengthens product marketing ROI because every move ties back to evidence, not assumptions.
Simple truth: what gets measured gets improved.
Types of Product Marketing KPIs
Before diving into how to track anything, it helps to break KPIs into clear buckets. This makes it easier to know what to measure and why it matters. Different KPIs tell different stories, and when you look at them together, you get a more honest picture of product growth.
Short overview. That’s all you need to start.
1. Sales Performance Metrics
These show whether the product is actually converting interest into revenue. If these numbers move, the rest of the business usually feels it.
- Revenue growth
- Conversion rate
- Average deal size
2. Customer Engagement Metrics
Once people start using the product, these metrics reveal how they interact with it. They help you see if users find value and stick around long enough to experience it.
- User adoption
- Churn rate
- Net Promoter Score (NPS)
3. Marketing Efficiency Metrics
These KPIs highlight how effectively the marketing budget is being used. They’re especially helpful when teams need to defend or adjust spend.
- Cost per acquisition (CPA)
- Return on marketing investment (ROMI)
4. Brand Awareness Metrics
These tell you how visible the product is in the market. Even if sales look stable, weak awareness metrics can hint at future trouble.
- Website traffic
- Social media mentions
- Share of voice
Together, these categories form a practical set of product marketing KPIs examples that support real decision-making and steady marketing metrics for product growth.
How to Track Product Marketing KPIs
Tracking KPIs shouldn’t feel like some stiff, formal process. In most teams, it works best when it’s simple, a bit flexible, and easy enough that people actually stick to it. Think of it as building a habit rather than building a dashboard. Some days the data will make perfect sense, some days it won’t. That’s normal.
Here’s a more grounded way to approach it, the way real teams manage it, not the shiny “perfect system” version.
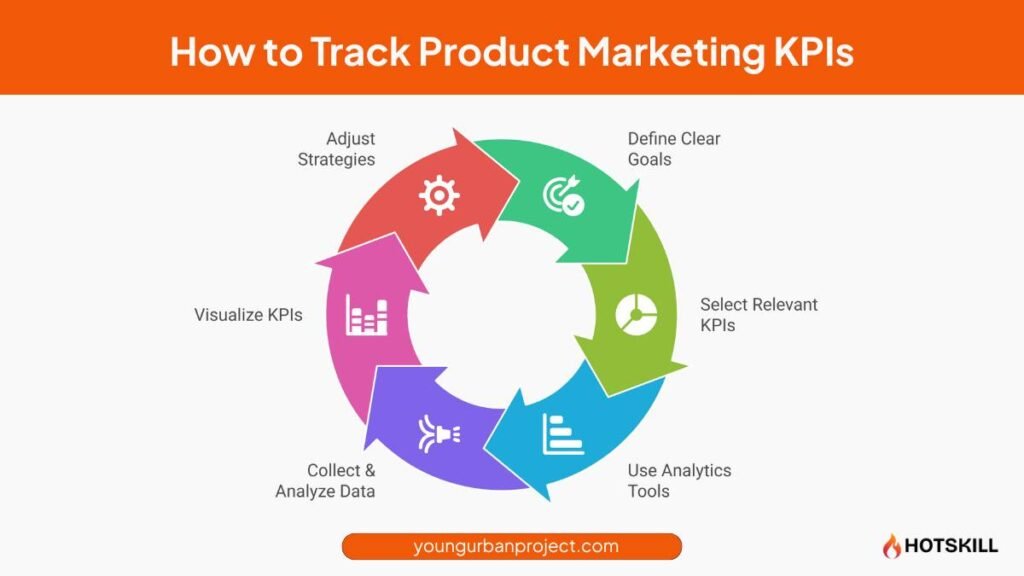
Step 1: Define Clear Goals
Everything starts with knowing what the product is trying to achieve right now. Goals shift. Markets shift. Even internal priorities shift. So KPIs need to match whatever the product actually needs in this moment.
A few quick ways teams usually think about it:
- When the push is awareness, you pay attention to impressions, reach, traffic, basically anything that shows people noticed you.
- When the aim is adoption, you care about activation, sign-ups, and how many users actually take the first meaningful step.
- When it’s revenue, the numbers tighten up around conversions and average order values.
Clear goals make KPI selection easier. Without this step, tracking becomes random and messy. And honestly, this is where many teams go off track, they pick KPIs before knowing the destination.
Short note: clarity saves everyone time.
Step 2: Select Relevant KPIs
Once the goals are clear, choosing KPIs becomes less of a guessing game. The key is to keep things practical. If a metric doesn’t help you make a decision, it’s probably not worth tracking.
A few that tend to work well across product stages:
- Customer acquisition cost, a quick pulse check on efficiency
- Conversion rate, tells you if your funnel is actually doing its job
- Engagement rate, shows whether people care enough to interact
- Retention rate, probably the truest sign of long-term value
Teams often get tempted by vanity metrics. It happens. But the best-performing teams lean toward relevant product marketing KPIs that translate into real actions, not feel-good numbers that sit on a slide.
Sometimes one strong KPI beats five weak ones.
Less noise, more clarity.
Step 3: Use Analytics Tools
Now comes the part where tools help, not overwhelm. You don’t need ten dashboards. You just need data that updates reliably and doesn’t require a full-time analyst to maintain.
A few tools that usually cover most needs:
- Google Analytics for behaviour and traffic
- Mixpanel for product usage
- HubSpot for campaign performance
- Salesforce for anything tied to revenue
Most tools today let you automate reports or set alerts. Use that. It removes the “Did someone update the sheet?” chaos that slows teams down. When tracking becomes automatic, reviewing results becomes easier and more consistent.
This is the real benefit of solid marketing analytics platforms, less manual work, more space to think.
Step 4: Collect & Analyze Data
With data flowing in, the next step is understanding what it’s saying. This part isn’t glamorous, but it’s where most insights come from.
Different teams check at different rhythms:
- Fast-moving campaigns? Daily.
- Standard performance? Weekly.
- Bigger picture trends? Monthly.
Once you start reviewing, look for the simple things first:
- Slow, steady trends
- Unexpected spikes
- Drops that happen right after a change
- Patterns you keep seeing again and again
It doesn’t have to be complicated. Often a small shift in one metric reveals more than a long spreadsheet ever could. Over time, this becomes a habit, and that habit shapes stronger decisions.
This is the core of good marketing data analysis.
Step 5: Visualize KPIs for Stakeholders
Not everyone wants to dive into raw numbers, and that’s fair. Visuals help teams absorb what’s going on without spending time decoding spreadsheets.
Stick to simple visuals:
- Clean dashboards
- Trend lines
- Bars and basic charts
If a graph needs an explanation longer than a few seconds, it’s too complicated. Visualizing KPIs isn’t about making data pretty, it’s about making the next step obvious. When stakeholders understand the numbers quickly, discussions move faster and decisions get made sooner.
Good visuals make product marketing performance easy to grasp at a glance.
Step 6: Adjust Strategies Based on Insights
This is where KPI tracking actually pays off. Numbers without action are just… numbers.
Teams usually adjust by:
- Tweaking campaigns that aren’t moving
- Updating targeting based on behaviour patterns
- Rewriting messaging that doesn’t land
- Shifting budgets to stronger-performing channels
Sometimes the adjustment is tiny. Sometimes it’s a complete reset. Both are normal. The important part is reacting while the data is still useful, not after the campaign has run its full course.
This is what true data-driven product marketing looks like, steady, informed tweaks that stack up over time.
Also Read: Social Media Marketing Performance
Best Practices for Tracking Product Marketing KPIs
Set SMART KPIs
In most teams, goals get tossed around until nobody’s sure what they’re actually chasing. So having SMART KPIs helps keep everyone on the same page. Not in a textbook way, more like, “Alright, this is what we’re aiming for, let’s not move the goalpost every week.” When KPIs are clear enough, conversations stop drifting and people can tell if things are working or just looking busy. It’s not perfect, but it cuts a lot of noise.
Maintain consistency in measurement
Numbers only tell a proper story when they’re tracked the same way, on the same rhythm. Otherwise everything looks like a random spike or dip. Even a simple weekly check builds a pattern you can actually follow. Miss a few cycles and suddenly nobody remembers what “normal” looked like. Consistency sounds boring, but it’s what turns scattered data into something the team can trust.
Benchmark against competitors or historical data
A metric on its own doesn’t say much, it just sits there. When you look at it next to past performance or what other players in the market are doing, it starts making sense. Sometimes the team feels stuck, but the whole market is moving slow. Other times things look steady, but you’re quietly losing ground. These comparisons keep decisions grounded in the real world instead of gut guesses.
Common Mistakes to Avoid
Focusing on too many KPIs
Dashboards get crowded fast. Someone adds one more metric “just in case,” and suddenly there are twenty. When that happens, nothing stands out. The team ends up staring at charts without knowing what deserves attention. Cutting it down to a handful of meaningful KPIs usually works a lot better. Less glamorous, sure, but the focus is sharper.
Ignoring customer behavior data
Top-line numbers look clean, but they hide a lot. The small things users do, where they pause, what they repeat, where they back out, those patterns tell you what’s actually going on. Teams often skim past this because it takes a bit more digging. But skipping it means missing the warning signs that show up long before a metric drops.
Not updating KPIs based on changing product goals
Products shift direction all the time, sometimes subtly. KPIs don’t always keep up. And then teams keep chasing numbers that meant something months ago but don’t really fit anymore. A quick check every few weeks helps catch this. Just asking, “Does this still make sense?” avoids a lot of wasted effort.
Conclusion
Tracking product marketing KPIs ends up being one of those things that feels boring at first but quietly shapes every smart decision later. Teams usually realise this only after running a few campaigns blind. Once the numbers start coming in regularly, even the small movements begin to make sense. A sudden dip. A slow climb. A random spike that makes everyone pause for a second. These things tell their own stories, long before a major win or loss shows up.
And the system doesn’t need to be flawless. Most teams try to perfect everything and then don’t start at all. It works better when the focus stays on just a few KPIs that truly matter at that stage of the product. As things shift (as they always do) the KPIs shift with them. That’s normal.
What really keeps everything on track is the habit. Regular check-ins. Quiet patterns forming. Data turning useful instead of loud.
FAQs: Product Marketing KPIs
What are the most important KPIs for product marketing?
Most teams end up relying on a small set that actually tells a story without flooding everyone with numbers. Revenue for the overall health. Conversion rate to see if the funnel is doing its job. Engagement to get a feel for how people use the product. Churn to know who stays. And brand awareness for reach. Not fancy, just useful.
How often should product marketing KPIs be tracked?
The timing really shifts based on what’s running. Fast campaigns often need quick, almost daily checks because things can drift fast. Bigger, slower initiatives usually work fine with weekly or monthly reviews. The main thing is keeping the rhythm steady. When tracking gets irregular, the patterns start getting muddy and harder to read.
Which tools are best for tracking marketing KPIs?
Teams usually mix a few tools instead of sticking to one. Google Analytics helps with behavior on the site, while HubSpot or Mixpanel make it easier to follow user journeys. Salesforce fills in the revenue side. Some still use spreadsheets because they’re simple and quick. The tool doesn’t matter as much as the habit of actually checking it.
Can KPIs change over time?
They do, and they should. Products move into different phases, priorities shift, markets change. A KPI that once fit perfectly might suddenly feel out of place. When the list isn’t updated, teams end up chasing goals that don’t match what the product needs now. A small review every few weeks keeps things aligned and stops the drift.
How do KPIs help improve marketing strategies?
KPIs bring out the small signals that aren’t obvious at first glance. A campaign might look steady on the outside, but the numbers can show drop-offs, stronger messages, or unexpected behavior. These little clues help teams tweak things slowly instead of making big risky changes. Over time, those small improvements stack up and the whole strategy gets sharper.